


WASHINGTON – The uninsured rate of full-time, year-round workers rose 0.6 percentage points in 2021 as more worked in occupations such as food service and construction that are less likely to provide private health coverage to employees.
But those who worked less than full time, year-round were not as likely to be uninsured in 2021 as public health insurance programs increased in response to the COVID-19 pandemic.
The U.S. Census Bureau’s Health Insurance Coverage in the United States: 2021 report released today shows that most people (54.3%) in 2021 still received health insurance coverage through their employer or a family member’s job.
Among workers ages 19 to 64, the percentage is even higher at 71.2%, although the percentage varied across different types of workers..
Those working full time, year-round were more likely to have employer-sponsored coverage (77.7%) than those who worked fewer hours or only part of the year (53.5%). Those working less than full time, year-round in 2021 were more likely to have public coverage such as Medicaid.
Private or public coverage?
Between 2020 and 2021, there were changes in health insurance coverage rates for both full-time, year-round workers and those who worked less than full time, year-round.
The uninsured rate for full-time, year-round workers was 0.6 percentage points higher in 2021 than in 2020. Compared to 2020, a larger share of these workers had public coverage and a smaller share had private coverage, such as employer-based coverage.
Those who worked less than full time, year-round were 1.2 percentage points less likely to be uninsured in 2021 — not because more had private coverage but because a larger share had public health insurance.
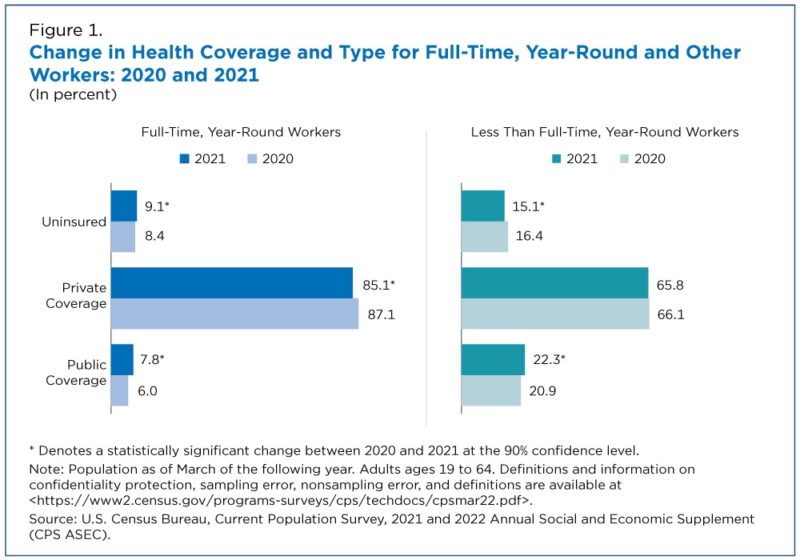
Policies addressing the COVID-19 public health emergency may have contributed to the increase in public coverage among all types of workers. For example, Congress extended mandated continuous coverage for those with Medicaid for the duration of the public health emergency and introduced additional measures to increase access to care by reducing the cost of coverage.
But changes in private coverage of full-time, year-round workers cannot be explained by a major policy change like this.
Instead, private coverage changes may have stemmed from changes in the composition of the workforce between 2020 and 2021: The number of full-time, year-round workers increased by 10.4 million and the percentage of adults ages 19 to 64 who worked full time, year-round increased by 5.6 percentage points to 56.7%.
Changes in Full-Time Occupations
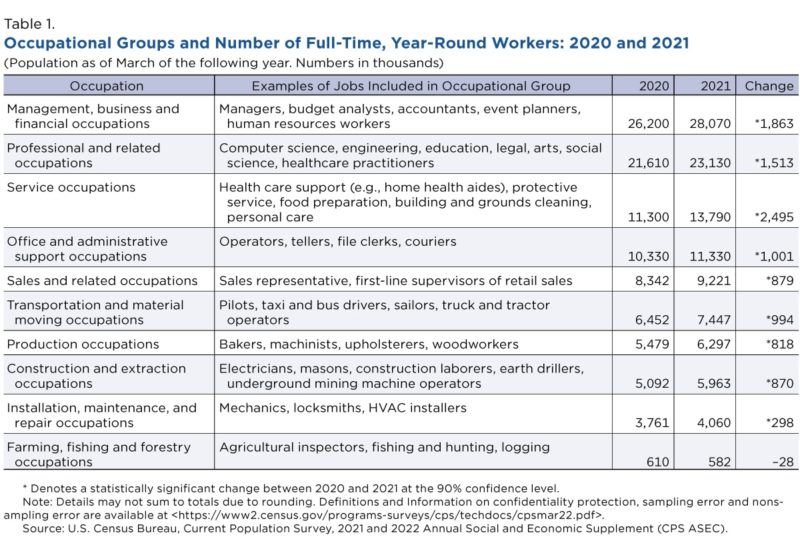
The increase in full-time, year-round work, however, did not happen evenly across all occupation groups.
Some jobs are less likely to provide health coverage to workers. For example, recent Census Bureau research showed that service and transportation occupations were less likely to offer benefits (such as health insurance) and that these occupations were more likely to experience declines in full-time, year-round employment during the COVID-19 pandemic in 2020.
As the economy recovered, if new full-time, year-round workers in 2021 were hired in these occupations, we might expect the percentage of full-time, year-round workers with employer-based insurance to decrease.
Between 2020 and 2021, there were increases in full-time, year-round workers in every occupational category except for agricultural workers (Table 1).
The occupation with the largest increase in full-time, year-round workers were service occupations: up 2.5 million to about 13.8 million.
When some occupational groups gain full-time, year-round employees faster than others, the share of full-time workers in each occupation group shifts.
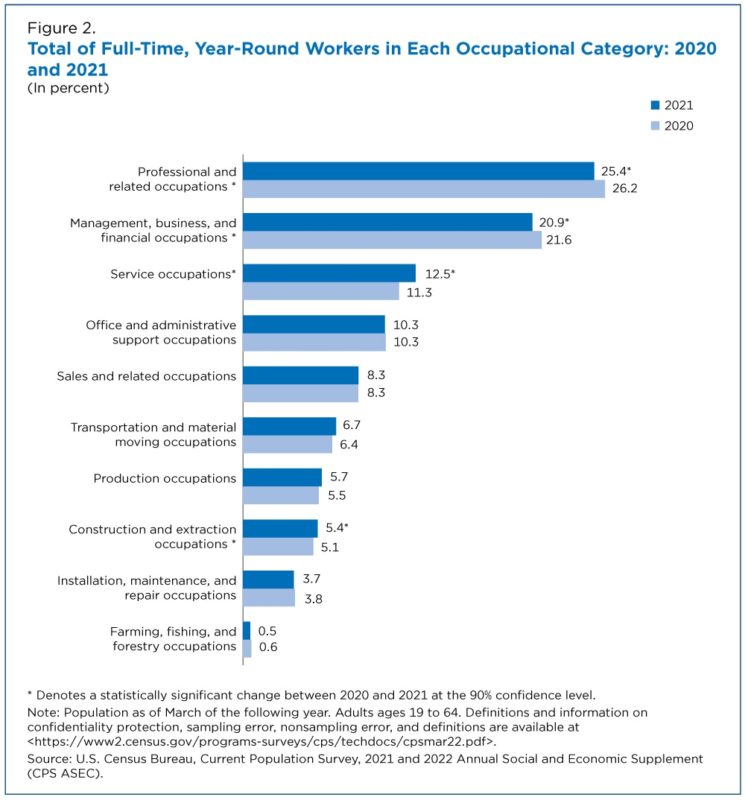
In 2021, the types of occupations that full-time, year-round workers participated in changed. For example, in 2021 the percentage of full-time, year-round workers in management and financial occupations or professional occupations decreased by 0.7 and 0.8 percentage-points, respectively.
At the same time, the share of full-time, year-round workers working in service occupations increased by 1.2 percentage points, and the share of full-time, year-round workers in construction occupations increased 0.3 percentage points.
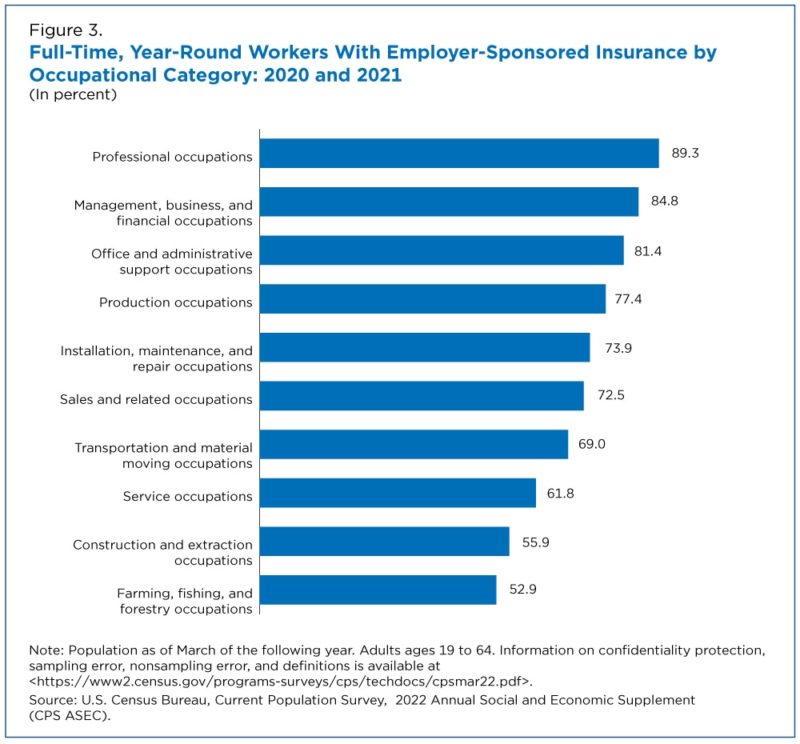
If the occupations that increased their share of the total workforce were occupations less likely to provide employer-based insurance, then the rate of full-time, year-round workers receiving employer-based insurance and total private coverage would fall (Figure 3).
The occupations that grew the most in 2021 were service and construction. Both had a low percentage of workers with employment-based insurance: 61.8% of service workers and 55.9% of construction workers.
At the same time, the occupations that experienced a drop in their share of full-time, year-round employees — professional and management — had the highest employer-sponsored insurance rates: 89.3% and 84.8%, respectively.
As a result, changes in the composition of occupations among full-time, year-round workers could have contributed to the shift in full-time, year-round private insurance use and overall change in health insurance coverage rates for this group.
Katherine Keisler-Starkey is an economist, Laryssa Mykyta is branch chief and Lisa Bunch is a survey statistician in the Census Bureau’s Health and Disability Statistics Branch.


