Average cost of a new home approximately $307,000
Putnam County – Construction in Putnam County has been trending in the right direction for months. But, the number of permits issued was lower in November than in that same month in 2021.
In comparison, last month saw 22 permits worth $5 million of construction issued, 15 of which were for single-family, residential homes. November of last year saw 35 permits for $7.4 million issued. 19 of those were single-family homes. A more prohibitive cost may be the culprit.
The average cost of a new home last month was approximately $307,000. That is up drastically from Nov. 2021 when the average cost landed at $286,000.
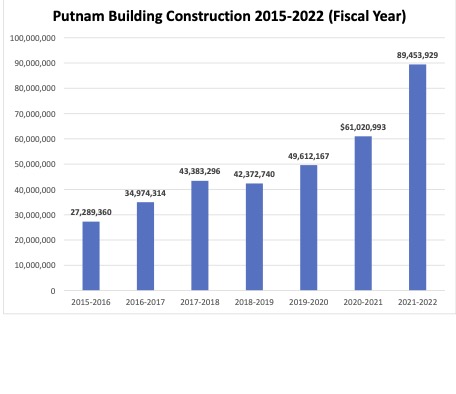
“We are going to set a new all-time record in the number of permits and construction cost for the calendar year 2022,” said Putnam County Mayor Randy Porter. “We still have December to go and have already beat last year’s record of construction cost by almost $20 million. We only need 4 permits in December to beat 2020’s total permits of 399.”
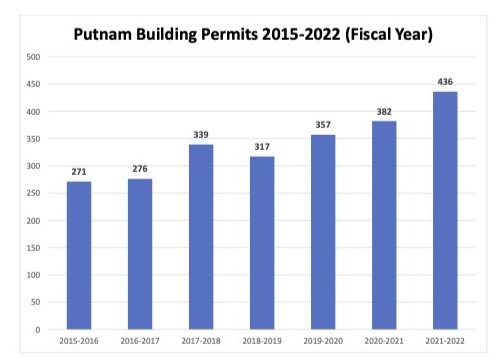
The following graph is a year-to-year comparison of permits issued in the county.
| 2019 | 2020 | 2021 | 2022 | |||||
| Permits | Total Amount | Permits | Total Amount | Permits | Total Amount | Permits | Total Amount | |
| January | 16 | 2,750,000 | 21 | 2,164,000 | 21 | 6,259,335 | 28 | 8,516,500 |
| February | 10 | 1,216,000 | 12 | 2,106,000 | 14 | 1,794,700 | 39 | 7,960,443 |
| March | 31 | 5,005,500 | 37 | 4,988,300 | 52 | 11,445,470 | 30 | 6,355,500 |
| April | 35 | 4,246,600 | 40 | 4,989,299 | 40 | 6,648,166 | 46 | 9,177,568 |
| May | 28 | 3,675,000 | 38 | 6,005,175 | 32 | 4,588,000 | 39 | 6,575,375 |
| June | 32 | 4,114,400 | 54 | 7,986,208 | 26 | 3,848,100 | 51 | 15,624,742 |
| July | 28 | 4,043,700 | 44 | 6,130,500 | 26 | 3,306,000 | 41 | 9,911,325 |
| August | 28 | 4,093,500 | 38 | 5,666,600 | 26 | 4,066,823 | 31 | 6,679,000 |
| September | 26 | 3,656,585 | 30 | 3,120,440 | 49 | 8,220,500 | 30 | 7,751,000 |
| October | 37 | 4,461,300 | 37 | 4,636,482 | 38 | 7,145,878 | 39 | 5,533,500 |
| November | 23 | 3,625,500 | 28 | 3,111,200 | 35 | 7,481,500 | 22 | 5,041,000 |
| December | 13 | 1,492,600 | 20 | 3,772,000 | 29 | 5,023,100 | ||
| TOTALS | 307 | $42,380,685 | 399 | $54,676,204 | 388 | $69,827,572 | 396 | 89,125,953 |
The numbers represent county numbers and do not include the four cities. Below is a chart representing Putnam building permits trends since 2015.

Photos and numbers courtesy of Randy Porter.


